Recession-proof your marketing strategy
2022년 8월 2일 — Bill Watkins

Costs are rising. A recession is looming. Consumer confidence is dropping rapidly. Your job is to find the most efficient channels where people are still spending—even spending more. And in times of market contraction, it’s more important than ever to prove your channels are working.
Moments like this, advertisers and marketers tend to rush to that last-click, bottom-of-the-funnel ROAS quick fix. But the latest research from Neustar and e-commerce firm Fospha suggests that’s a costly mistake. Go all-in on last click and you’ll leave precious dollars on the table. Instead, focus on unbiasing your results so that you have visibility into what actually generated demand and increased your total revenue. The people who take a little longer to convert also spend more money, so accounting for them in your measurement means squeezing more out of every dollar you spend. And there’s nothing more recession-proof than that.
Unbias your ROAS reporting
If you’re relying on some leading tools like Google Analytics, you’re not getting a clear, unbiased picture of ROAS. You’re grading on a curve, and bottom-of-the-funnel will always win on conversion—because it doesn’t consider how much bigger that conversion might have been. In their latest report (not commissioned by Pinterest), e-commerce firm Fospha anonymized data from their global clients and looked across clicks and view through equally, and their results might surprise you. When it comes to strong performance, challenger brands like Pinterest actually stand out, despite showing lower investment levels among brands in the survey.
ROAS for all channels, according to Fospha1
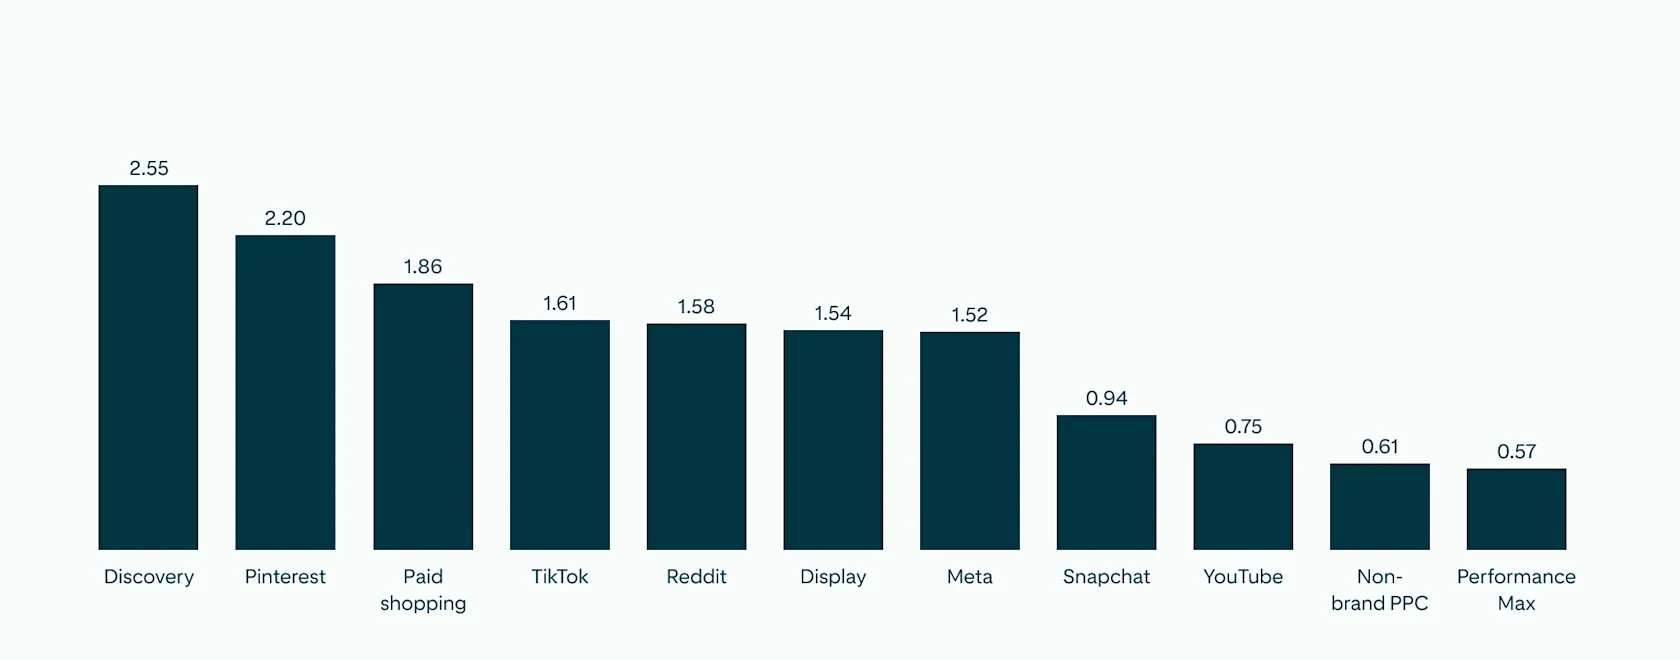
Source: Fospha, State of eCommerce Advertising Report, Jan-Mar 2022
And Fospha isn’t alone. The latest data from Neustar reinforces the value of thinking beyond last-click. Neustar conducted a two-year MTA study across retail, entertainment, financial services, telecom and insurance verticals. In their graph below, compare the right bar (clicks-based attribution) to the left bar (multi touch attribution), and suddenly, you have a much different picture of your most efficient channels.
Media efficiency by channel
(incremental attributed conversions per $1k spend, measuring all touches)2
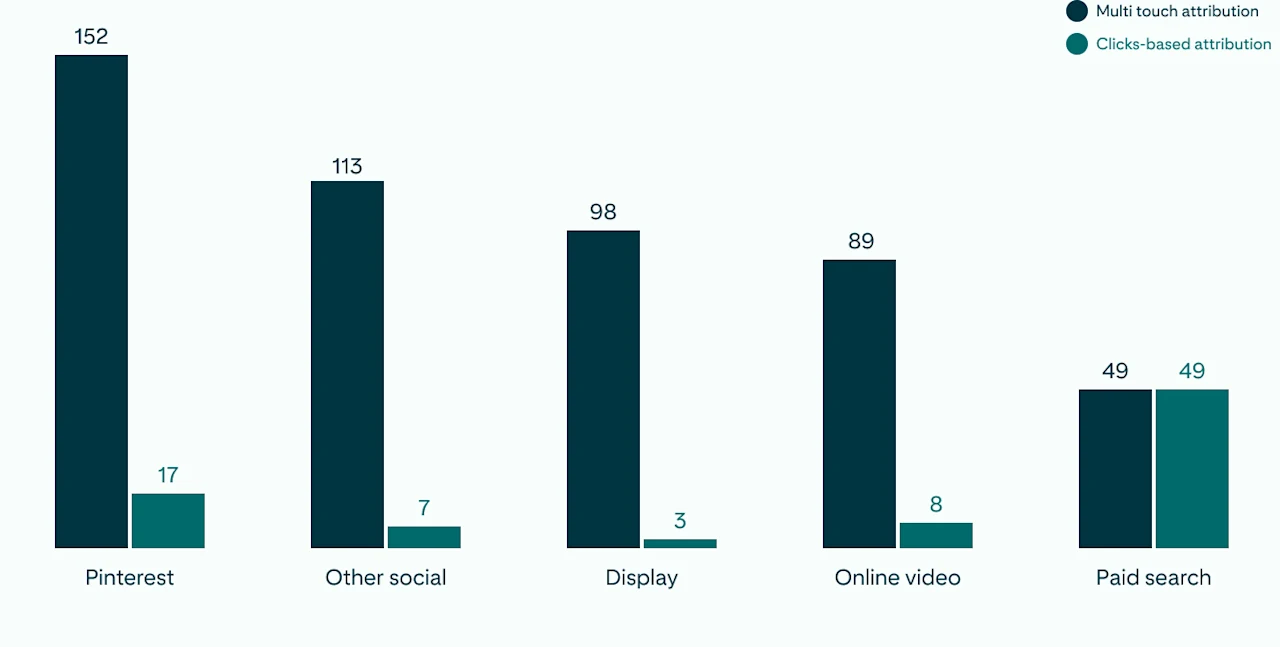
Source: Neustar, attribution meta study commissioned by Pinterest. N = 22 brands. US, Q1 2020- Q1 2022
Convert the big spenders who take more time
The magic of moving up the funnel is that open minds open wallets—and increase average order value (AOV). When people arrive more open-minded, less decided, they ultimately buy and spend more. Look no further than the Fospha data, to prove this out, too:
Source: Fospha, State of eCommerce Advertising Report, Jan-Mar 2022
Of this graphic, Fospha writes, “Pinterest in particular is an aspirational platform that people are known to use for shopping inspiration, so it makes sense that customers spend a bit more when they’re acquired from there.”1 The Neustar research, again, backs up their data: 91% of people who convert on Pinterest saw an ad there mid funnel.2 And, ultimately, they spent more. People on Pinterest outspend people who don't use Pinterest by 80% every month, and also have 40% larger baskets.3
Seeing the full return on your investment
So why aren’t you catching these converters in your results? Because they’re taking their sweet time. Those big spenders on Pinterest are significantly more likely than people on other platforms to take a week to make a purchase.3 In fact, three quarters of conversions on Pinterest take more than one week.4
If you're measuring only clicks (1/0/0, or 1 day click, 0 days to engage, 0 days to view), you’re not valuing the view. That means you won’t capture those people that take longer to convert and ultimately spend more. For example, in the Neustar study, campaigns that only measured last touch or last click understated total conversions attributable to Pinterest by nearly 4x.2
But don’t stop at adding a 1 day view. Widen your attribution windows to see those slower conversions, too. For example, if you’ve got a 1/1/1 attribution window (measuring 1 day click, 1 day to engage, 1 day to view), you’re not seeing the much higher ROAS that can come from giving those shoppers, say, a full week to consider. When people take a week or more to make a purchase, they spend about 50% more overall in a month.3 Using, for example, a 7 or 30 day attribution window instead of 1 day allows you to capture that demand generation in your measurement and see overall higher conversions—higher ROAS—across channels. Look at what happens when advertisers large and small extend their attribution window from 1/1/1 to 7/7/7 on Pinterest—more conversions, like magic:
How expanded attribution windows impact conversion rates (rate shown as percentage)5
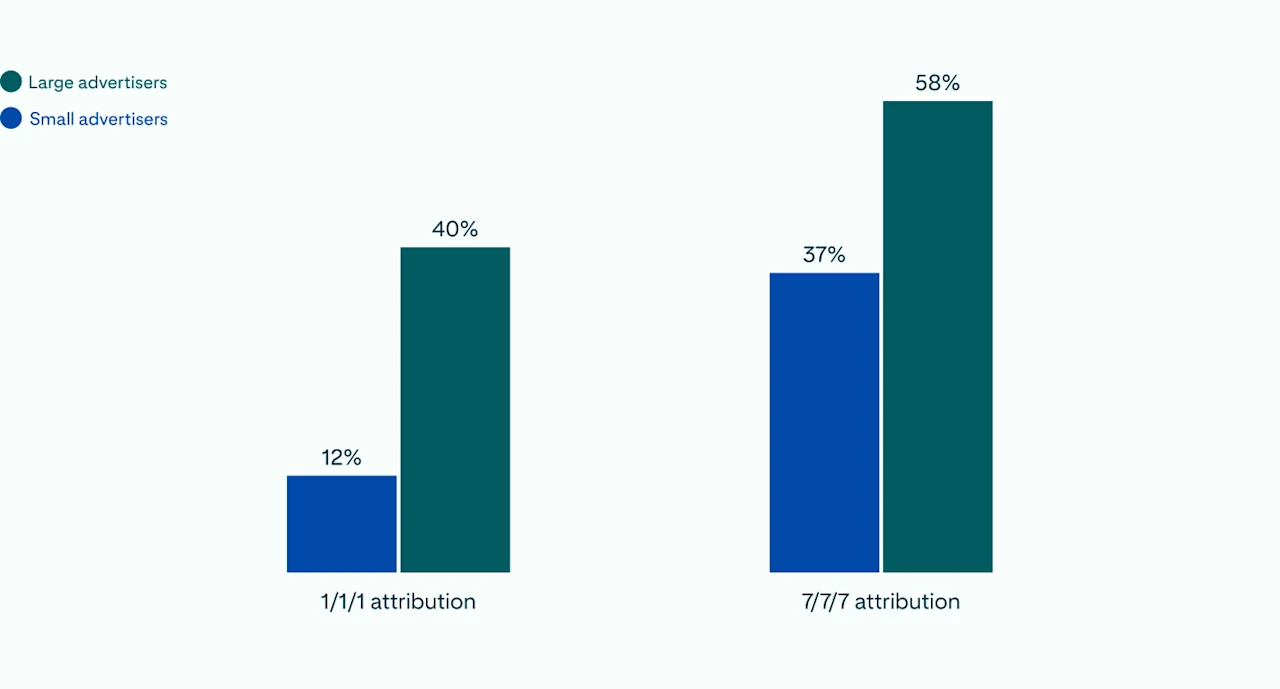
Source: Pinterest internal data, time to conversion analysis, global, Q1 2021 - Q3 2021
Make every dollar go further
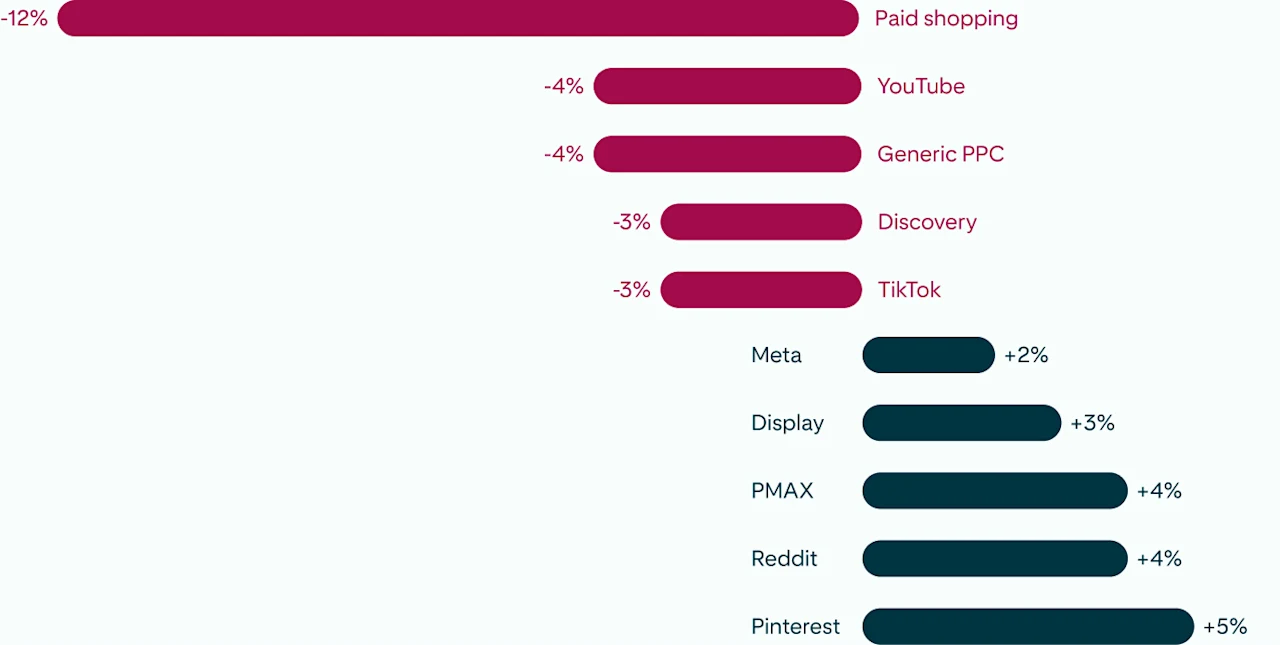
Because converters who take more time also spend more money, accounting for them in your measurement means you’ll squeeze more out of every dollar you spend. Pinterest, for example, contributes beyond its investment for both incremental conversions and revenue, according to Neustar:
More conversions and more revenue for every dollar spent2
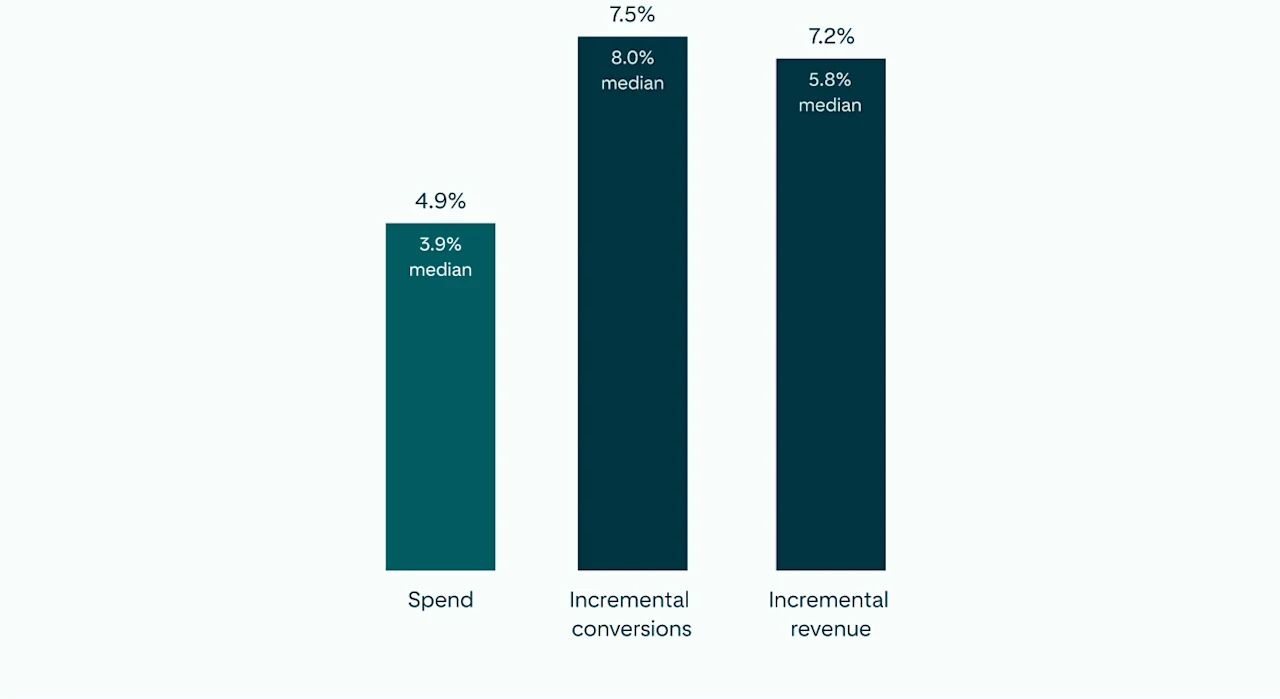
Source: Neustar, attribution meta study commissioned by Pinterest. N = 22 brands. US, Q1 2020- Q1 2022
Yes, when people have more time, they buy more. But it’s also about the quality of that time. A more inspiring environment makes people more open to trying and buying. In a recent global research study with Sparkler, representing seven different countries, more than 60% of participants agreed, “when I’m in an inspirational environment or mindset, I’m more likely to explore and discover things to try or buy.”6 Given that Pinterest is the #1 channel for inspiration according to Nielsen—over even magazines or TV—it makes sense that inspired shoppers on Pinterest spend more.7
“
60% of participants in a global Sparkler study agreed, “when I’m in an inspirational environment or mindset, I’m more likely to explore and discover things to try or buy.”6
Three actions you can take
As a recession looms, consumers will be more thoughtful about how they spend their money. They’ll take their time making purchase decisions. And that’s not a bad thing for your bottom line—as long as you aren’t limiting yourself to last-clicks.
Expand your attribution window
Expand your attribution window: To accurately quantify ROAS for your Pinterest media, widen your attribution windows in Pinterest Ads Manager. Don't miss out on the 75% of the conversions that happen after one week. If you're at 1/1/1, at minimum, explore the 7/7/7. You’ll find the sweet spot, where you’re accounting for those big spenders who buy more—and seeing a higher ultimate ROAS for your campaigns.
Get a more holistic view of performance
Two of our advanced solutions will give you even more insight into your Pinterest performance. First, be sure your teams have implemented enhanced match; and second, if you have a Pinterest representative that you work with, talk to them about accessing the Pinterest API for Conversions beta.
Work with a Pinterest Business Partner
Consider working with a measurement partner that will help you understand your ROAS performance across multiple channels in the most accurate way possible. For example, you want to avoid traditional site analytics solutions that only account for conversions that happen in the same browser, device and session. Consider MTA (multi touch attribution) to show your cross-platform impact, as the Fospha and Neustar research in this article did.